Debugging and Building your app

App-Review

Debugging and building your app can be a daunting task. You want to make sure that your application is running as smoothly as possible, but every time you make a change you run the risk of introducing errors. This blog post provides some tips on how to debug your app and make changes without introducing errors. From setting up your development environment to debugging tools, read on to learn everything you need to know to build and debug your app successfully.

What is a Debugging Process?
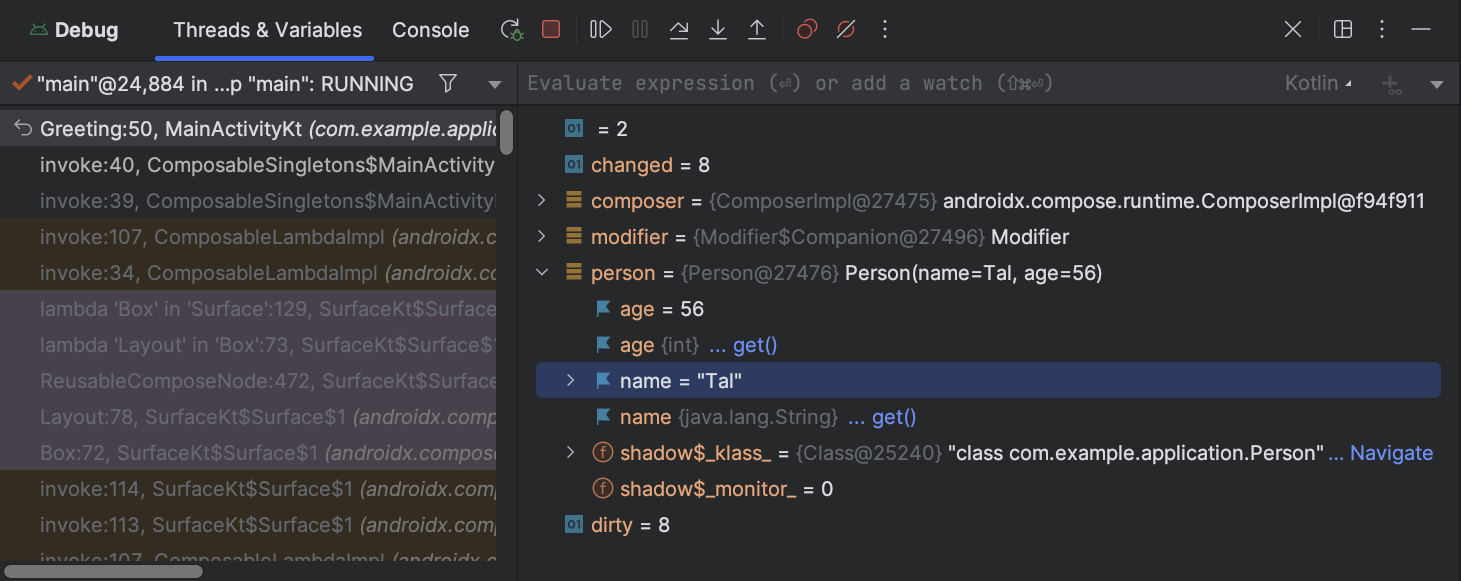
Debug your app | Android Developers

Image Source: Link

A debugging process for software development is the systematic investigation of a system in order to identify and correct errors. Debugging is typically divided into two phases: pre-debugging and debugging.

Pre-debugging activities include identifying the problem, determining its cause, and designing a plan to solve it. This involves understanding the system design, analyzing data flows, and understanding how the software behaves. Once the problem has been identified, debugging begins with systematically testing hypotheses to find the source of the error. Debugging can also involve modifying or enhancing code to confirm that it works as intended.

Once you find an error, fixing it requires knowledge of both the codebase and how it interacts with other parts of the system. Reaching a solution often requires taking multiple steps: verifying that the fix works as intended, making sure that all affected systems are updated, and documenting changes so that future developers can reproduce the issue if necessary.

How to Debug Your App?

If you are having trouble debugging your app or building it, there are a few things you can do to help.

First, make sure you have the correct version of the SDK and tools installed. The SDK comes with a debug build of Android Studio which makes debugging and building much easier.

Second, try to break your app in a way that is specific to your problem. This will help you pinpoint where the issue lies.

Third, use logging and profiling to see where your app is spending its time and how it is behaving. This information can be helpful in diagnosing and fixing issues. Additionally,logging can help you track down errors that might not show up in normal execution traces.

Fourth, search for answers on Stack Overflow or Google Groups related to your problem. There are likely people out there who have encountered the same issue before and may have some good advice on how to solve it.

Finally, post your question on Stack Overflow or Google Groups with the tag “android” so that others might find it too.

What are the Different Types of Debugging Tools?

You can divide debugging tools into three categories:

  1. Functional debugging – You can use it to find and fix errors in your code that have nothing to do with the user interface. Moreover, you can use it for things like finding where a function is calling too many times or checking that a variable is being set correctly.
  2. Performance debugging – You can use this to find and fix errors that affect the speed of your app. It can track down issues like slow network connections or memory leaks.
  3. User experience debugging – You can use this to find and fix errors that affect how the user interacts with your app. It can identify problems with how your controls look or how your menus work.

Testing and Debugging Your Application

Debugging is the process of finding and fixing problems in a computer program. You can do debugging with a variety of different tools, but the most common are source code analysis tools, such as debuggers or profilers.

Building your app is the process of creating all of the files and modules that make up your application. This includes writing source code, creating documentation, and setting up build scripts.

Conclusion

In this final article in our series on app development, we’re going to take a look at how to debug and build your app. Debugging is essential for finding and fixing errors in your code, while building ensures that your application is runnable and meets all the required specifications. In this article, we’ll cover both of these topics in depth, so be sure to read through it before moving on to the next stage of app development.

FAQs

1. What are the common tools and features available in Xcode for debugging Swift applications?

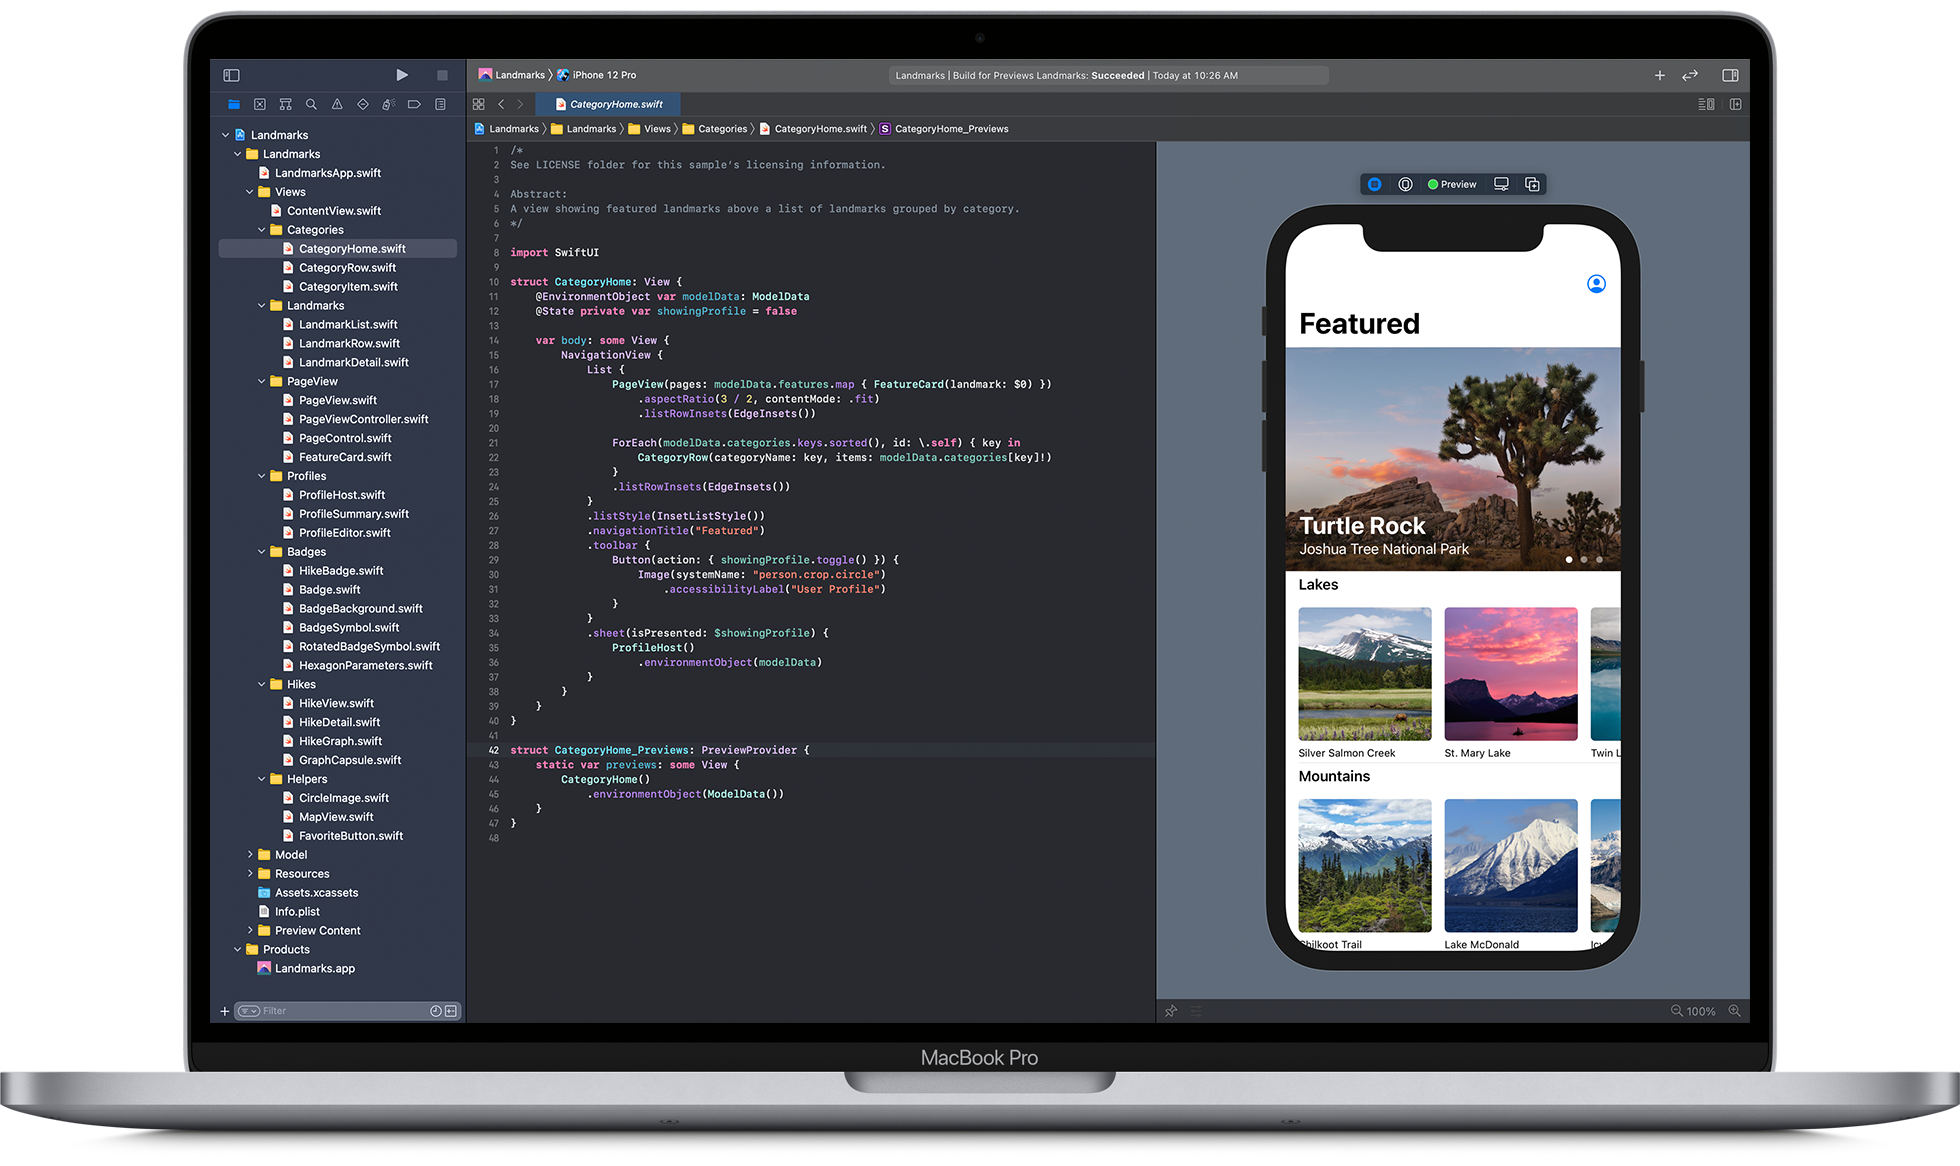
Answer: Xcode offers a comprehensive set of tools and features for debugging Swift applications, including:

  • LLDB Debugger: A powerful debugger integrated into Xcode that supports breakpoints, stepping through code, and inspecting variables.
  • Breakpoints: You can set breakpoints to pause the execution of your code at specific lines or conditions, allowing you to inspect the app’s state.
  • Console: The console displays log messages, error messages, and allows you to interact with the debugger using LLDB commands.
  • Debug Navigator: Provides a high-level overview of the app’s call stack, threads, and active breakpoints.
  • View Debugging: A visual tool that lets you inspect the UI hierarchy and view properties, which is useful for resolving layout issues.

2. How can I effectively use breakpoints in Xcode to debug my app?

Answer: Breakpoints are essential for pausing the execution of your app to inspect its state. Here’s how to use them effectively:

  • Setting Breakpoints: Click the gutter next to the line number where you want to pause execution. A blue indicator will appear.
  • Conditional Breakpoints: Right-click on a breakpoint and select “Edit Breakpoint…” to add conditions or actions, such as pausing only when a variable has a specific value.
  • Symbolic Breakpoints: Use symbolic breakpoints to pause execution when a specific method or function is called, regardless of its location in the code.
  • Exception Breakpoints: Add an exception breakpoint to pause execution whenever an exception is thrown, helping you catch and debug runtime errors.

3. What steps should I take to build and run my app on a physical device?

Answer: To build and run your app on a physical device, follow these steps:

  1. Connect Your Device: Connect your iOS device to your Mac using a USB cable.
  2. Select the Device: In Xcode, select your project in the Project Navigator. Then, choose your connected device from the device selector at the top of the Xcode window.
  3. Configure Signing: Go to the “Signing & Capabilities” tab in your project settings. Ensure that your Apple ID is selected as the team and that the provisioning profile is configured correctly.
  4. Build and Run: Click the “Run” button (a play icon) in the Xcode toolbar. Xcode will build your app and install it on your device. You might need to trust the developer profile on your device under Settings > General > Device Management.

4. How can I use the Xcode Instruments tool for performance debugging?

Answer: Xcode Instruments is a powerful tool for profiling and performance debugging. Here’s how to use it:

  1. Open Instruments: In Xcode, go to Product > Profile or press Command + I to open Instruments.
  2. Select a Template: Choose a profiling template based on what you want to measure, such as Time Profiler, Allocations, or Leaks.
  3. Run Your App: Instruments will launch your app and start collecting data. Use the timeline and various instruments to analyze performance metrics, memory usage, and more.
  4. Analyze Data: Use the collected data to identify performance bottlenecks, memory leaks, and other issues. Drill down into specific time periods, methods, and threads to understand the root cause of problems.

5. What are some best practices for debugging Swift code efficiently?

Answer: Here are some best practices for efficient debugging:

  • Use Assertions: Use assert and precondition to catch bugs early by verifying assumptions in your code.
  • Leverage Logging: Use print statements and NSLog to log important information and variable states. Consider using third-party logging frameworks for more advanced features.
  • Refactor for Testability: Write modular and testable code. Unit tests can help catch issues early and make debugging easier.
  • Understand Stack Traces: Learn to read and understand stack traces to quickly identify where crashes and exceptions occur.
  • Automated Testing: Use automated testing to catch regressions and ensure your code behaves as expected after changes.
  • Documentation and Comments: Write clear documentation and comments to explain complex logic, making it easier to debug and understand your code later.

Leave a Reply

Your email address will not be published. Required fields are marked *